Leveraging Data For Enhanced Performenced:
The Adidas Dataset
Executive Summary:
The case study evaluates a model predicting customer churn using the Adidas dataset. The model achieved an accuracy of 73.1%, with a precision of 68% for non-churned customers and 77% for churned customers. Recall was 70% for non-churned and 76% for churned, with a weighted average F1-score of 73%. The Confusion Matrix provided insights into True Positives, True Negatives, False Positives, and False Negatives, from which key performance metrics were derived. Business implications emphasized the need to improve precision, focus retention efforts on identified churners, and regularly monitor and adjust the model. Additionally, the study identified opportunities for targeted re-engagement strategies and suggested analyzing purchasing patterns of high total sales customers with high recency values.
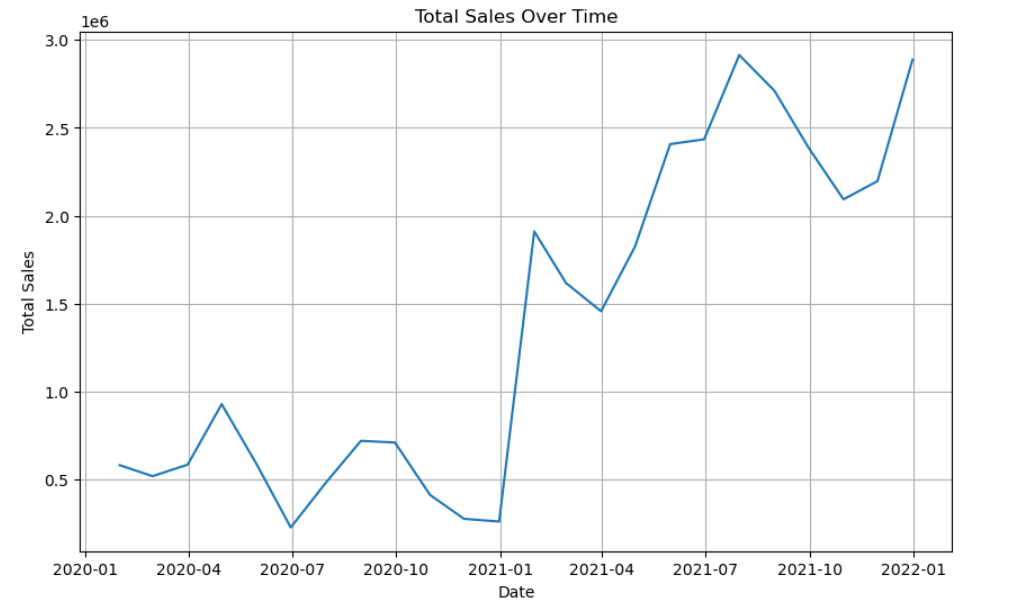
Sales Analysis
- Track customer acquisition: Monitor new customer influx across various periods and identify acquisition patterns.
- Mid-2020 Decline: Significant drop in sales around mid-2020.
- Recovery and Steady Increase (2020-07 to 2021-01): Gradual recovery and consistent increase in sales.
- Significant Sales Spike (2021-01 to 2021-07): Substantial spike, indicating strong sales performance.
- Fluctuating Sales with Overall Growth (2021-07 to 2022-01): Fluctuations with overall growth, nearing a peak by January 2022.
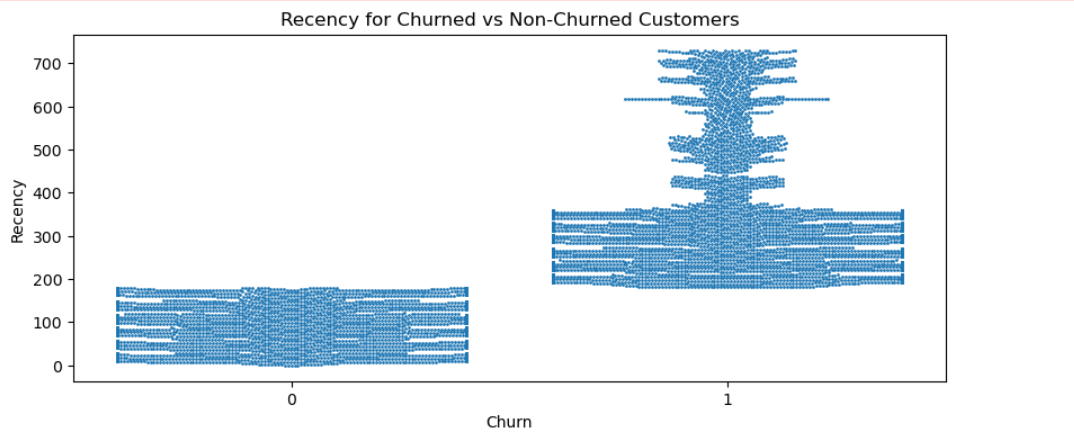
Observations
Non-Churned Customers (Churn = 0):
Distribution: Compact, concentrated in lower recency range (0 to ~200).
Implication Frequent engagement, indicating active customer base.
Churned Customers (Churn = 1):
Distribution: More spread out, extending to higher recency values (up to ~700).
Implication Less frequent engagement, suggesting longer periods of inactivity before churning.
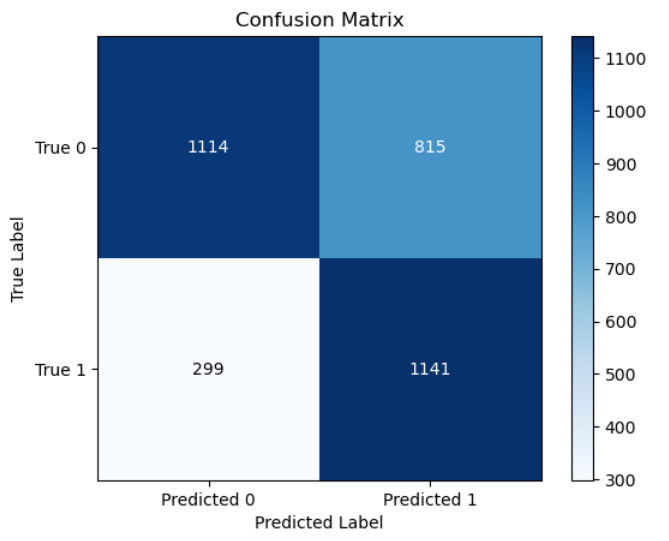
Confusion Matrix Details
True Positive (TP): 1141
These are cases where the model correctly predicted the customers who churned (True 1).
True Negative (TN): 1114
These are cases where the model correctly predicted the customers who did not churn (True 0).
False Positive (FP): 815
These are cases where the model incorrectly predicted customers as churned when they actually did not churn (Type I error).
False Negative (FN): 299
These are cases where the model incorrectly predicted customers as not churned when they actually did churn (Type II error).
Unveiling Our Dynamic
Software Alchemy
We follow an agile software development approach for all types of development projects

Accelerating Innovation, Amplifying Impact: We transform visions into reality
© 2025 360XpertSolutions. All rights reserved.